发表于: 2017-10-17 22:18:50
1 802
一、今日完成
1.学习使用JMeter和badboy进行压力测试
压力测试:通过确定一个系统的瓶颈或者不能接收的性能点,来获得系统能提供的最大的服务级别的测试。
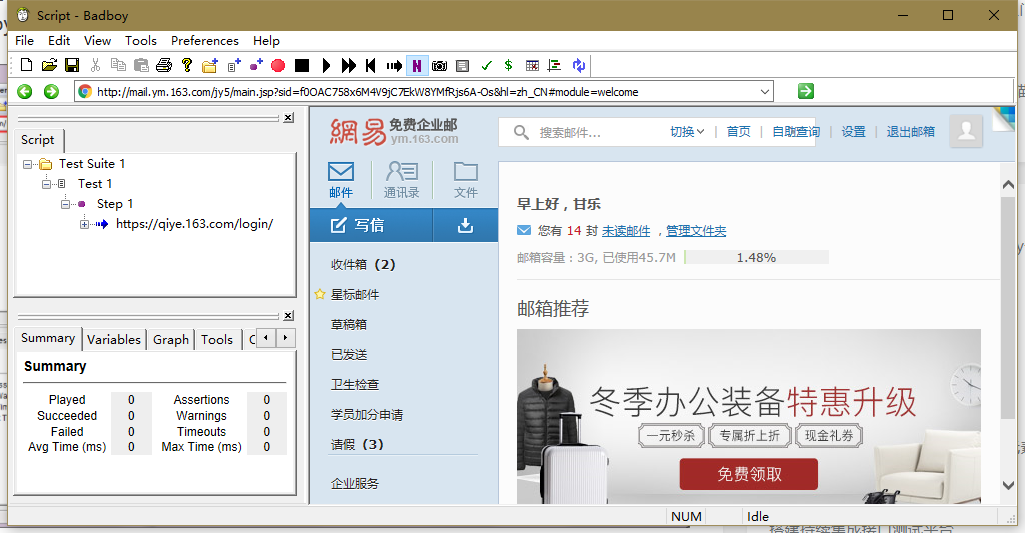
(1)安装启动badboy,输入URL,开始录制脚本;
(2)停止录制,选择“File -> Export to JMeter”,将录制脚本导出为JMeter脚本格式。
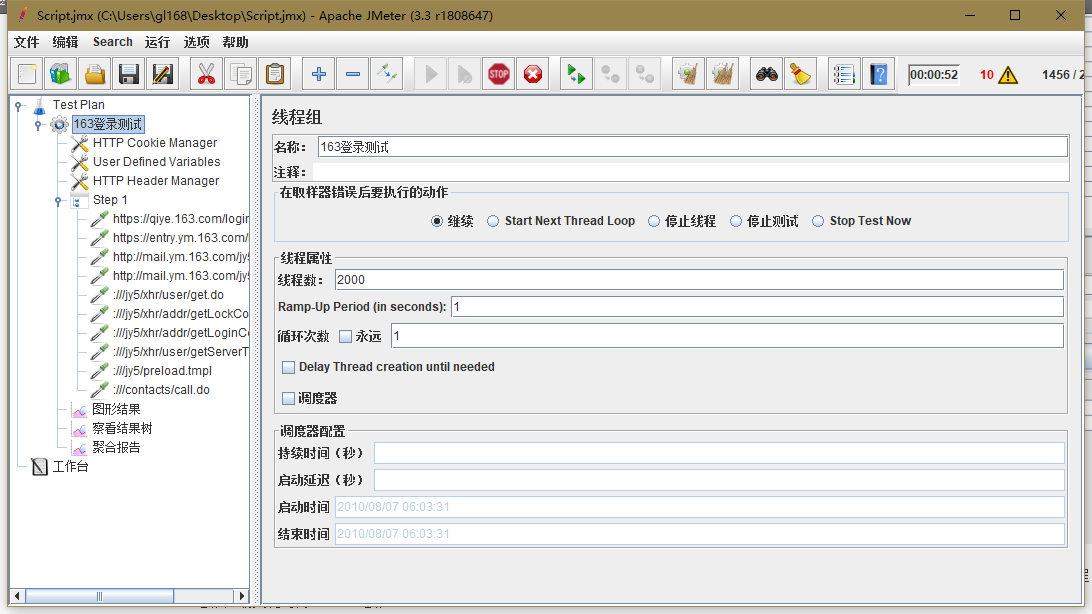
(3)打开JMeter会有一个默认的测试计划,点击文件-打开,选中录制的脚本文件如:Script.jmx,打开脚本进行测试。
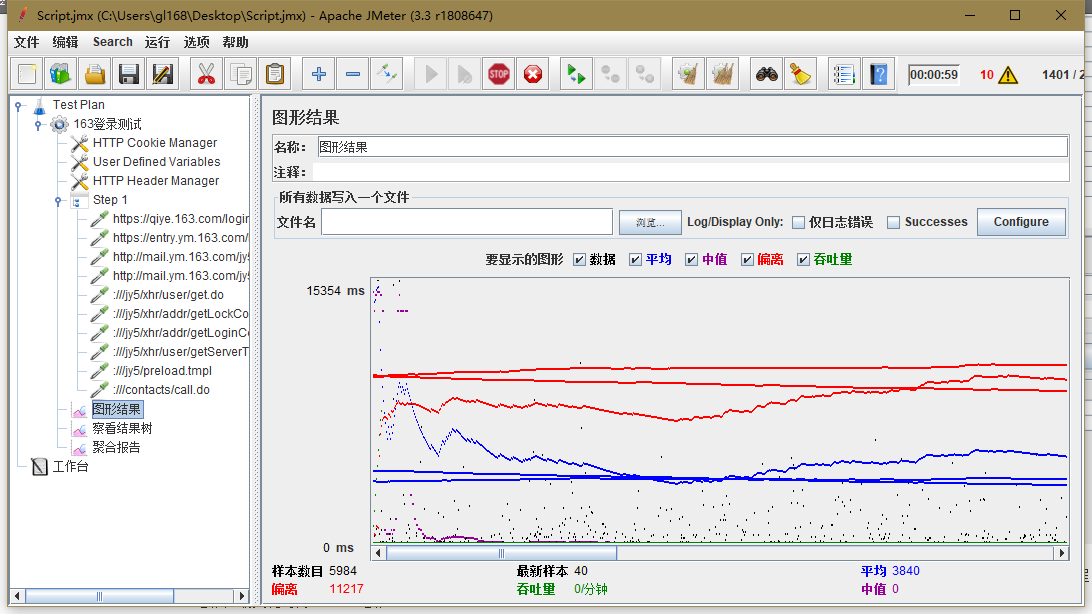
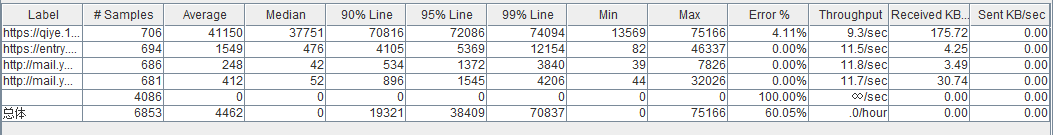
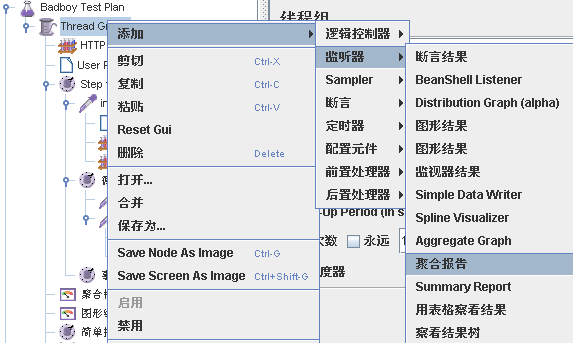
(4)在线程组上添加监听器-聚合报告、图形结果等,设置并发次数,点击运行-启动,开始测试,测试完毕后就可以看到测试结果。
2.了解Jmeter主要组件
a.测试计划(Test Plan):使用JMeter进行测试的起点,是其它JMeter测试元件的容器。
b.线程组(Thread Group):代表一定数量的并发用户,可以用来模拟并发用户发送请求。
c.取样器(sampler):定义实际的请求内容,被线程组包含,我们主要用HTTP请求。
d.监听器(Listener):负责收集测试结果,同时也被告知了结果显示的方式。常用的包括:聚合报告、察看结果树、用表格查看结果,都支持将结果数据写入文件。
e.逻辑控制器(Logic Controller):可以自定义JMeter发送请求的行为逻辑,它与Sampler结合使用可以模拟复杂的请求序列。
其分为循环控制器和事务控制器。
f.断言(Assertions):可以用来判断请求响应的结果是否如用户所期望的。它可以用来隔离问题域,即在确保功能正确的前提下执行压力测试。这个限制对于有效的测试是非常有用的。
g.配置元件(Config Element):维护Sampler需要的配置信息,并根据实际的需要会修改请求的内容。我们主要在参数化中用到CSV Data Set Config。
h.前置处理器(Pre Processors)和后置处理器(Post Processors)
负责在生成请求之前和之后完成工作。前置处理器常常用来修改请求的设置,后置处理器则常常用来处理响应的数据。我们主要在动态关联中用到后置处理器的正则表达式提取器。
i.定时器(Timer):负责定义请求之间的延迟间隔。
3.学习redis-benchmark工具做压力测试
root@acer:~# redis-benchmark --help
Usage: redis-benchmark [-h <host>] [-p <port>] [-c <clients>] [-n <requests>] [-k <boolean>]
-h <hostname> Server hostname (default 127.0.0.1) --主机ip地址
-p <port> Server port (default 6379) --端口
-s <socket> Server socket (overrides host and port) --socket(如果测试在服务器上测可以用socket方式)
-a <password> Password for Redis Auth
-c <clients> Number of parallel connections (default 50) --客户端连接数
-n <requests> Total number of requests (default 100000) --总请求数
-d <size> Data size of SET/GET value in bytes (default 3) --set、get的value大小
--dbnum <db> SELECT the specified db number (default 0) --选择哪个数据库测试(一般0-15)
-k <boolean> 1=keep alive 0=reconnect (default 1) -是否采用keep alive模式
-r <keyspacelen> Use random keys for SET/GET/INCR, random values for SADD --随机产生键值时的随机数范围
Using this option the benchmark will expand the string __rand_int__ inside an argument with a 12 digits number in the specified range from 0 to keyspacelen-1. The substitution changes every time a command is executed. Default tests use this to hit random keys in the specified range.
-P <numreq> Pipeline <numreq> requests. Default 1 (no pipeline). --pipeline的个数(如果使用pipeline会把多个命令封装在一起提高效率)
-e If server replies with errors, show them on stdout.
(no more than 1 error per second is displayed)
-q Quiet. Just show query/sec values --仅仅查看每秒的查询数
--csv Output in CSV format --用csv方式输出
-l Loop. Run the tests forever --循环次数
-t <tests> Only run the comma separated list of tests. The test
names are the same as the ones produced as output. --指定命令
-I Idle mode. Just open N idle connections and wait. --仅打开n个空闲链接
Examples:
Run the benchmark with the default configuration against 127.0.0.1:6379:
$ redis-benchmark
Use 20 parallel clients, for a total of 100k requests, against 192.168.1.1:
$ redis-benchmark -h 192.168.1.1 -p 6379 -n 100000 -c 20 --测试set、get、mset、sadd等场景下的性能
Fill 127.0.0.1:6379 with about 1 million keys only using the SET test:
$ redis-benchmark -t set -n 1000000 -r 100000000 --测试set随机数的性能
Benchmark 127.0.0.1:6379 for a few commands producing CSV output:
$ redis-benchmark -t ping,set,get -n 100000 --csv --使用csv的输出方式测试
Benchmark a specific command line:
$ redis-benchmark -r 10000 -n 10000 eval 'return redis.call("ping")' 0 --测试基本命令的速度
Fill a list with 10000 random elements:
$ redis-benchmark -r 10000 -n 10000 lpush mylist __rand_int__ --测试list入队的速度
On user specified command lines __rand_int__ is replaced with a random integer
with a range of values selected by the -r option.
二、明日计划
使用Memcache做压测
三、遇到问题
暂无。
四、收获
以上。


评论