发表于: 2020-06-20 21:39:02
1 1642
今天完成的事情:任务三扫尾
明天计划的事情:明天做深度思考,再准备下小课堂内容。
遇到的问题:问题就是自己的AOP日志不生效,已经解决,就是下面的切入点没有配对。
收获:
AOP的切入点的定义,由于自己要AOP拦截Service的所有方法,所以需要扫描包下所有类的方法
通过execution函数,可以定义切点的方法切入
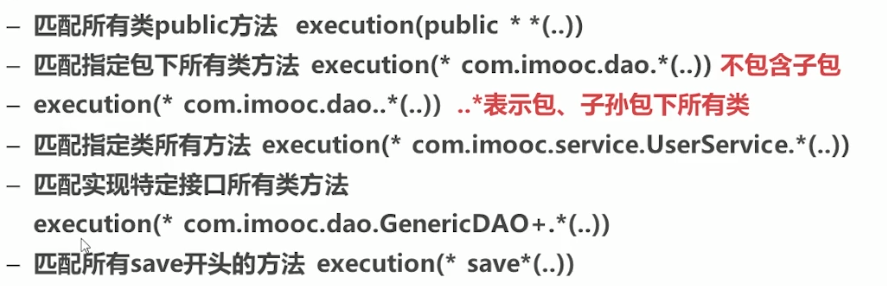
*语法 execution(<访问修饰符>?<返回类型><方法名>(<参数>)<异常>)
-匹配所有类public方法 execution(public * *(..))
-匹配指定包下所有类的方法 execution(*com.imooc.dao.*(..))不包含子包
- execution(*com.imooc.dao..*(..)) ..*表示包、子孙包下所有类
-匹配指定类所有方法execution(*com.imooc.service.UserService.*(..))
-匹配实现特定接口所有类方法 execution(*com.imooc.dao.GenericDAO+.*(..))
-匹配所有save开头的方法execution(*save*(..))
首先第一点,日志是在Nginx请求处理完后写入
Nginx配置在conf中的配置
log_format  main  'time_local=[$time_local] "$msec" request_time=["$request_time"] upstream_connect_time=["$upstream_connect_time"]  upstream_header_time=[ "$upstream_header_time"] upstream_response_time=["$upstream_response_time"] '
                    ' $remote_addr - $remote_user  "$request" '
                    '$status $body_bytes_sent "$http_referer" '
                    '"$http_user_agent" "$http_x_forwarded_for"'  ;

access_log  logs/access.log  main;
$time_local 很接近请求处理结束时间
$msec 是写入日志的时间戳,就是写入的时间点。所以$msec和$time_local 几乎是同一时间,因为写入日志很快,可以忽略。
$request_time 请求处理时间
$msec - $request_time 中间是减号哈,请求开始时间
$upstream_connect_time 与上游服务器建立连接所花费的时间
$upstream_header_time 建立与上游服务器的连接到接收响应头的第一个字节之间的时间
$upstream_response_time 建立与上游服务器的连接到接收响应主体的最后一个字节之间的时间
$upstream_header_time - $upstream_connect_time 中间是减号,得到的是服务器处理的时间。
下面是我测试的一个查询接口的耗损
 postman的数据
这个是Nginx日志记录,配置在上面。

分析得,
request_time请求总时间耗时1.062秒,
请求开始时间$msec - $request_time为 1592657790.334-1.062 = 1592657789.272(2020-06-20 20:56:29)
与上游服务器建立时间为27毫秒,服务器连接到返回第一个字节耗时1059毫秒,所以服务器耗时1032毫秒,接受字节花了(1062-1059)为3毫秒。
这个是我log日志文件,对服务器内service和Controller的内容
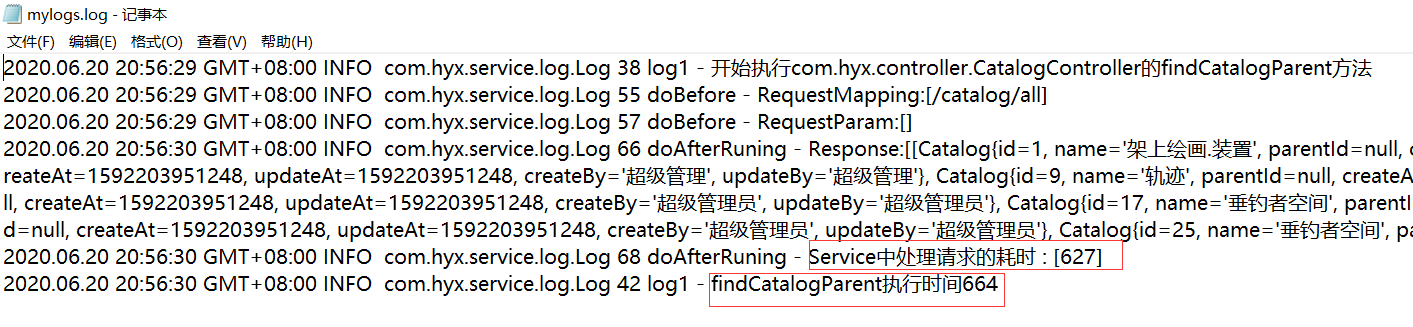
分析得,在service以上第一次访问数据库会耗时627毫秒,说明自己的表结构有问题,要加索引,我没加,然后在Controller返回到Nginx时间耗时为(1032-664),应该是自己封装的对象比较冗余。是啊
配置在下面
@Component
@Aspect
public class Log {
    //用来记录请求进入的时间,防止多线程时出错,这里用了ThreadLocal
    ThreadLocal<Long> startTime = new ThreadLocal<>();
    //定义日志对象
    Logger logger = LogManager.getLogger(Log.class);
    /**
     * 定义切入点,记录service下入参,返回值,耗时分布
     */
    @Pointcut(" execution(* com.hyx.service.Impl..*(..))")
    private void service(){}
    /**
     * 定义切入点,controll下面的所有类的方法的耗时
     */
    @Pointcut("execution(* com.hyx.controller..*(..))")
    private void controller(){}

    @Around(value = "controller()")
    public Object log1(ProceedingJoinPoint joinPoint) throws Throwable{

        String className =joinPoint.getTarget().getClass().getName();
        String methodName =joinPoint.getSignature().getName();
            logger.info("开始执行{}的{}方法",className,methodName);
            Long start = System.currentTimeMillis();
            Object object = joinPoint.proceed();
            Long end = System.currentTimeMillis();
            logger.info(methodName+"执行时间"+(end-start));
        logger.info("结束执行"+className+"中"+methodName+"执行时间"+(end-start));
        return object;
    }
    /*
    Service
     */
    @Before("service()")
    public void doBefore(JoinPoint joinPoint){
        startTime.set(System.currentTimeMillis());
        ServletRequestAttributes servletRequestAttributes = (ServletRequestAttributes) RequestContextHolder.currentRequestAttributes();
        HttpServletRequest request = servletRequestAttributes.getRequest();
        //打印当前请求路径
        logger.info("RequestMapping:[{}]",request.getRequestURI());
        //打印请求参数
        logger.info("RequestParam:{}",Arrays.toString(joinPoint.getArgs()));
    }

    /**
     *方法返回之前执行,打印才返回值以及方法消耗时间
     */
    @AfterReturning(returning = "response",pointcut = "service()")
    public void doAfterRuning(Object response){
        //打印返回信息
        logger.info("Response:[{}]",response);
        //打印Service中处理请求的耗时
        logger.info("Service中处理请求的耗时 : [{}]",System.currentTimeMillis()-startTime.get());
    }


}
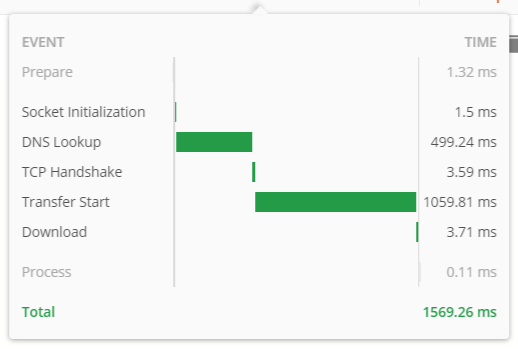
最后得出结论,在postman中测试,DNS解析花费了500ms,我会了解下怎么优化。其他的就是上面的分析。
这篇博客部分内容参考下,最重要的是下面链接的几个文章很有参考价值,推荐。


评论